Metrics
Each block deployed on Fransys has its own real-time metrics, accessible directly from the Metrics tab of its configuration panel.
Per-block metrics
Click on a block in the canvas, then open the Metrics tab to view its performance.
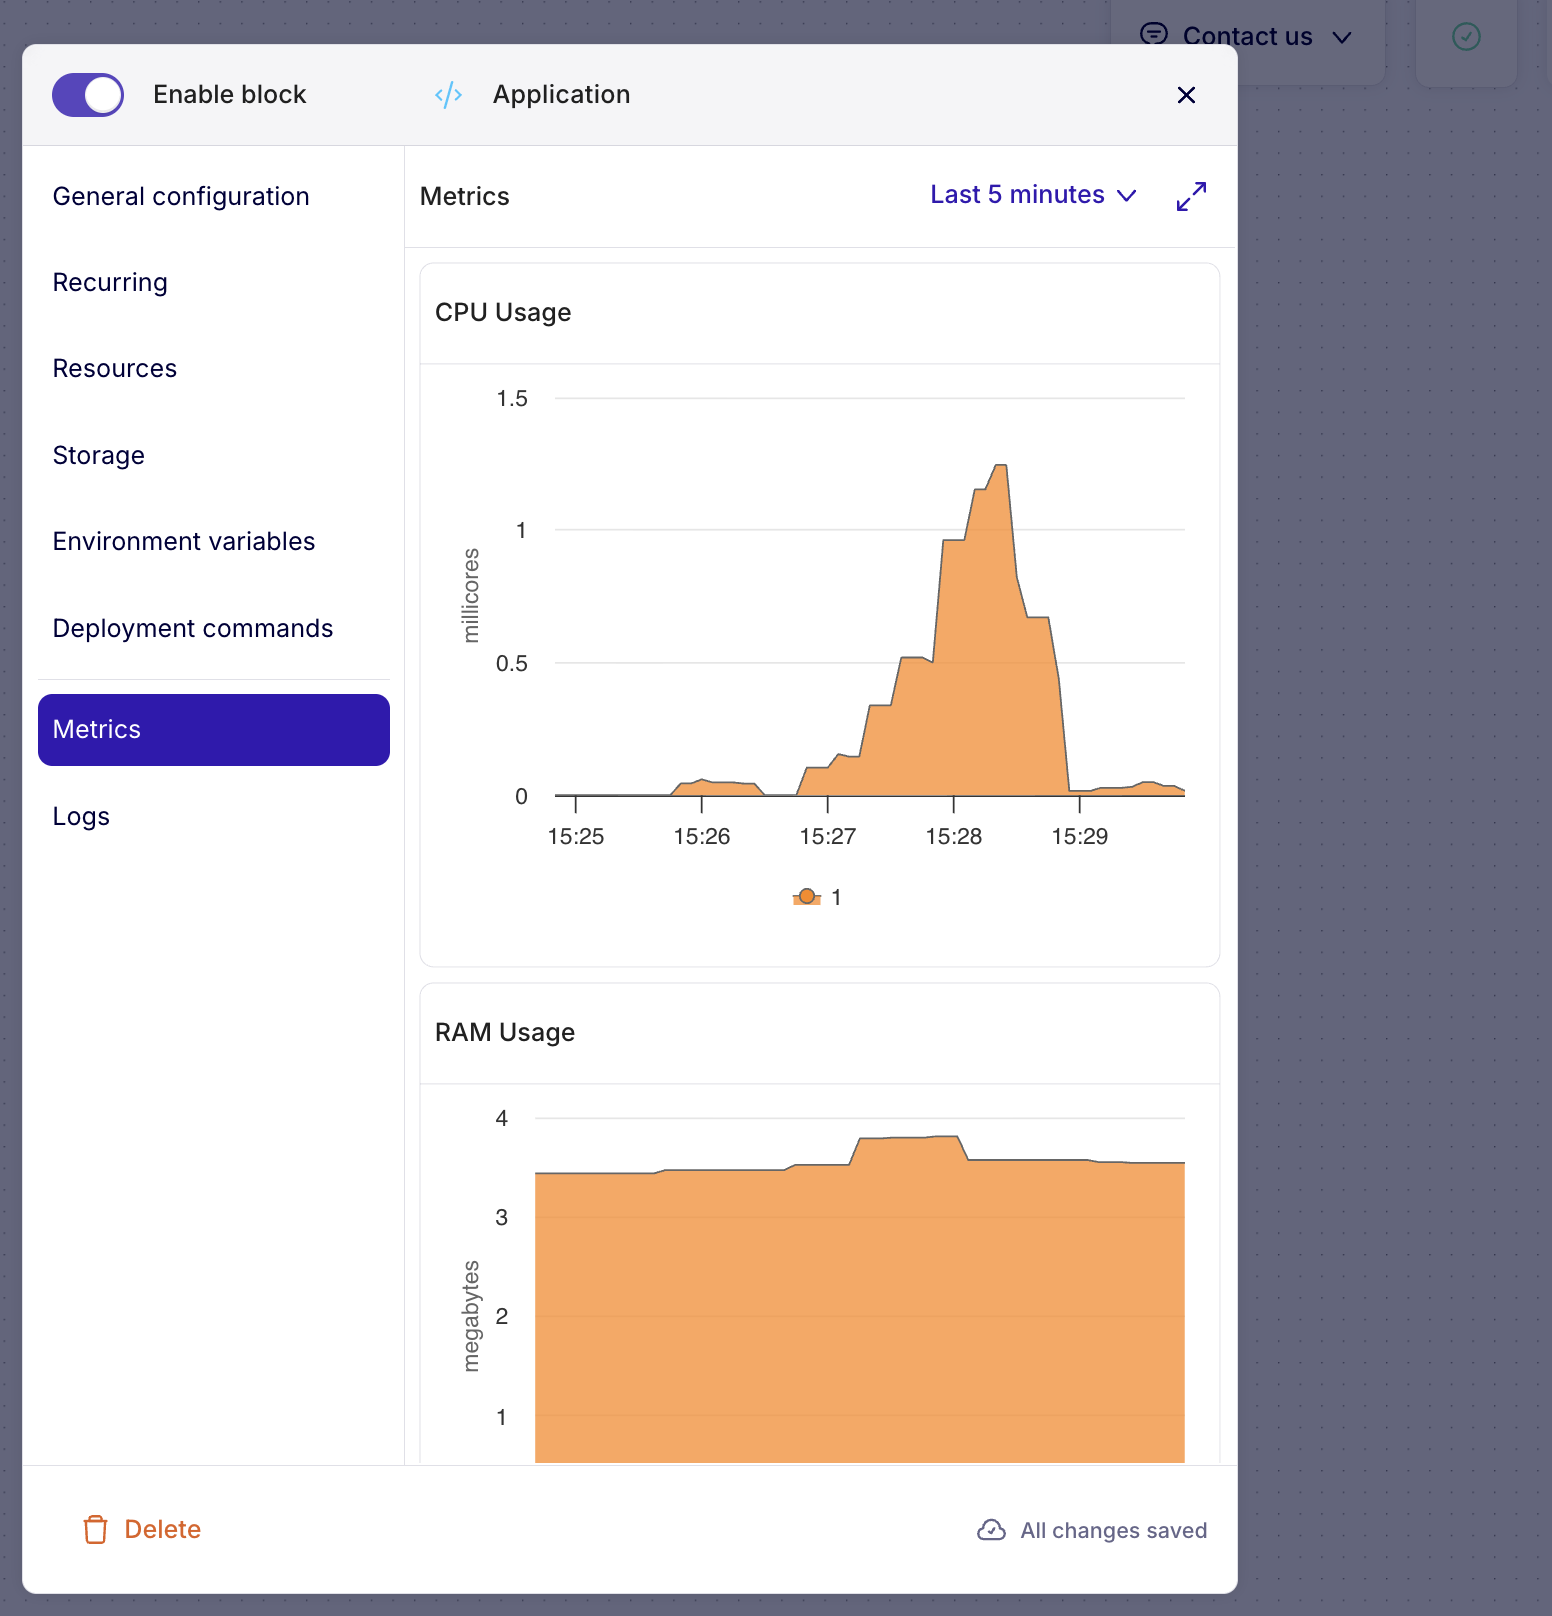
Two charts are displayed:
- CPU Usage — CPU usage in millicores over time
- RAM Usage — Memory usage in megabytes over time
Display period
The Last 5 minutes selector in the top right lets you adjust the time window. You can view metrics over different periods to identify trends or load spikes.
Full screen mode
The expand icon in the top right lets you open the charts in full screen for more detailed analysis.
Two levels of monitoring
Fransys offers monitoring at two levels:
| Level | Where | What you see |
|---|---|---|
| Cluster | Cluster dashboard → Overview / Project metrics | Global resources, node/pod health, consumption per project |
| Block | Block panel → Metrics | CPU and RAM of the individual service |
→ For cluster-level monitoring, see Cluster Dashboards
Monitor your blocks' metrics after a deployment to detect potential consumption spikes. If a block regularly consumes all its resources, adjust the limits in the Resources tab or enable horizontal scaling.